Money Flow Indicator (Chaikin Oscillator) with VWAPStrategy Overview
Entry Conditions:
Buy Entry:
The Chaikin Oscillator crosses above the signal line.
The current price is above the VWAP.
Sell Entry:
The Chaikin Oscillator crosses below the signal line.
The current price is below the VWAP.
Exit Conditions:
Profit Taking:
Take profit when a target profit is reached (e.g., a 2% increase from the entry price).
Stop Loss:
Set a stop loss, for example, at a 1% decline from the entry price.
Risk Management:
Manage risk by limiting each trade to no more than 1-2% of the account balance.
Calculate position size based on risk and trade accordingly.
Trend Confirmation:
Use other indicators (like moving averages) to confirm the overall trend and focus trades in the direction of the trend.
In an uptrend, prioritize buy entries; in a downtrend, prioritize sell entries.
Specific Trade Scenarios
Example 1: Buy Entry:
Enter a buy position when the Chaikin Oscillator crosses above the signal line and the price is above the VWAP.
Set a stop loss 1% below the entry price and a profit target 2% above the entry price.
Example 2: Sell Entry:
Enter a sell position when the Chaikin Oscillator crosses below the signal line and the price is below the VWAP.
Set a stop loss 1% above the entry price and a profit target 2% below the entry price.
Additional Considerations
Backtesting: Test this strategy with historical data to evaluate performance and make adjustments as needed.
Market Conditions: Pay attention to market volatility and economic indicators, adjusting the trading strategy flexibly.
Psychological Factors: Avoid emotional decisions and follow clear rules when trading.
Cari dalam skrip untuk "stop loss"

ATR Levels and Zones with Signals📌 ATR Levels and Zones with Signals – User Guide Description
🔹 Overview
The ATR Levels and Zones with Signals indicator is a volatility-based trading tool that helps traders identify:
✔ Key support & resistance levels based on ATR (Average True Range)
✔ Buy & Sell signals triggered when price enters key ATR zones
✔ Breakout confirmations to detect high-momentum moves
✔ Dynamic Stop-Loss & Take-Profit suggestions
Unlike traditional ATR bands, this indicator creates layered ATR zones based on multiple ATR multipliers, allowing traders to gauge volatility and risk-adjust their trading strategies.
🔹 How It Works
🔸 The script calculates a baseline SMA (Simple Moving Average) of the price.
🔸 ATR (Average True Range) is then used to create six dynamic price levels above & below the baseline.
🔸 These levels define different risk zones—higher levels indicate increased volatility and potential trend exhaustion.
📈 ATR Zones Explained
🔹 Lower ATR Levels (Buying Opportunities)
📉 Lower Level 1-2 → Mild Oversold Zone (Potential trend continuation)
📉 Lower Level 3-4 → High Volatility Buy Zone (Aggressive traders start scaling in)
📉 Lower Level 5-6 → Extreme Oversold Zone (High-Risk Reversal Area)
🔹 If price enters these lower zones, it may indicate a potential buying opportunity, especially if combined with trend reversal confirmation.
🔹 Upper ATR Levels (Selling / Take Profit Zones)
📈 Upper Level 1-2 → Mild Overbought Zone (Potential pullback area)
📈 Upper Level 3-4 → High Volatility Sell Zone (Aggressive traders start scaling out)
📈 Upper Level 5-6 → Extreme Overbought Zone (High-Risk for Reversal)
🔹 If price enters these upper zones, it may indicate a potential selling opportunity or trend exhaustion, especially if momentum slows.
🔹 Sensitivity Modes
🔹 Aggressive Mode (More Frequent Signals) → Triggers buy/sell signals at Lower/Upper Level 3 & 4
🔹 Conservative Mode (Stronger Confirmation) → Triggers buy/sell signals at Lower/Upper Level 5 & 6
📌 Choose the mode based on your trading style:
✔ Scalpers & short-term traders → Use Aggressive Mode
✔ Swing & trend traders → Use Conservative Mode for stronger confirmations
🚀 How to Use the Indicator
🔹 For Trend Trading:
✅ Buy when price enters the lower ATR zones (especially in uptrends).
✅ Sell when price enters the upper ATR zones (especially in downtrends).
🔹 For Breakout Trading:
✅ Breakout Buy: Price breaks above Upper ATR Level 3 → Momentum entry for trend continuation
✅ Breakout Sell: Price breaks below Lower ATR Level 3 → Momentum short opportunity
🔹 Stop-Loss & Take-Profit Suggestions
🚨 Stop-Loss: Suggested at Lower ATR Level 6 (for longs) or Upper ATR Level 6 (for shorts)
🎯 Take-Profit: Suggested at Upper ATR Level 3 (for longs) or Lower ATR Level 3 (for shorts)
🔹 Why This Indicator is Unique
✔ Multiple ATR layers for better risk-adjusted trading decisions
✔ Combines ATR-based zones with SMA trend confirmation
✔ Both aggressive & conservative trading modes available
✔ Includes automatic stop-loss & take-profit suggestions
✔ Breakout signals for momentum traders
📢 Final Notes
✅ Free & open-source for the TradingView community!
⚠ Risk Warning: Always confirm signals with other confluences (trend, volume, support/resistance) before trading.
📌 Developed by: Maddog Blewitt
📩 Feedback & improvements are welcome! 🚀

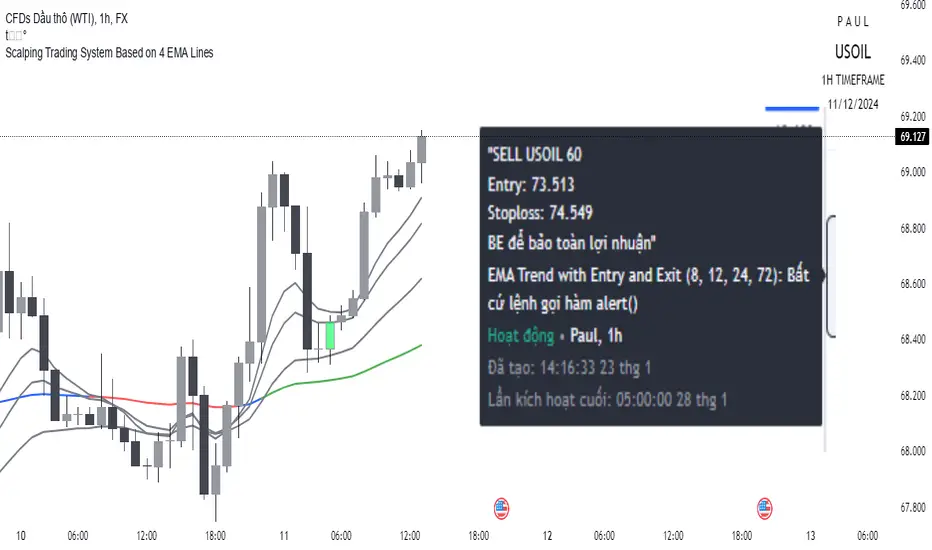
Scalping trading system based on 4 ema linesScalping Trading System Based on 4 EMA Lines
Overview:
This is a scalping trading strategy built on signals from 4 EMA moving averages: EMA(8), EMA(12), EMA(24) and EMA(72).
Conditions:
- Time frame: H1 (1 hour).
- Trading assets: Applicable to major currency pairs with high volatility
- Risk management: Use a maximum of 1-2% of capital for each transaction. The order holding time can be from a few hours to a few days, depending on the price fluctuation amplitude.
Trading rules:
Determine the main trend:
Uptrend: EMA(8), EMA(12) and EMA(24) are above EMA(72).
Downtrend: EMA(8), EMA(12) and EMA(24) are below EMA(72).
Trade in the direction of the main trend** (buy in an uptrend and sell in a downtrend).
Entry conditions:
- Only trade in a clearly trending market.
Uptrend:
- Wait for the price to correct to the EMA(24).
- Enter a buy order when the price closes above the EMA(24).
- Place a stop loss below the bottom of the EMA(24) candle that has just been swept.
Downtrend:
- Wait for the price to correct to the EMA(24).
- Enter a sell order when the price closes below the EMA(24).
- Place a stop loss above the top of the EMA(24) candle that has just been swept.
Take profit and order management:
- Take profit when the price moves 20 to 40 pips in the direction of the trade.
Use Trailing Stop to optimize profits instead of setting a fixed Take Profit.
Note:
- Do not trade within 30 minutes before and after the announcement of important economic news, as the price may fluctuate abnormally.
Additional filters:
To increase the success rate and reduce noise, this strategy uses additional conditions:
1. The price is calculated only when the candle closes (no repaint).
2. When sweeping through EMA(24), the price needs to close above EMA(24).
3. The closing price must be higher than 50% of the candle's length.
4. **The bottom of the candle sweeping through EMA(24) must be lower than the bottom of the previous candle (liquidity sweep).
---
Alert function:
When the EMA(24) sweep conditions are met, the system will trigger an alert if you have set it up.
- Entry point: The closing price of the candle sweeping through EMA(24).
- Stop Loss:
- Buy Order: Place at the bottom of the sweep candle.
- Sell Order: Place at the top of the sweep candle.
---
Note:
This strategy is designed to help traders identify profitable trading opportunities based on trends. However, no strategy is 100% guaranteed to be successful. Please test it thoroughly on a demo account before using it.
Follow Through Day (FTD) + Sweep [TrendX_]The Follow Through Day (FTD) + Sweep indicator is a Trend-following tool mixing William O'Neil's original FTD concept and Liquidity concept. This indicator helps you identify potential subsequent bullish trends with greater precision by combining volume analysis, price action, and liquidity concepts.
💎 FEATURES
Follow Through Day Candle (FTD Candle)
The FTD, pioneered by William O'Neil, serves as a reliable signal for identifying the beginning of new bull markets. It's particularly valuable because it combines multiple market factors - price action, volume, and timing - to confirm genuine market reversals rather than temporary bounces.
The power of the FTD lies in its ability to distinguish between ordinary market fluctuations and significant trend changes. By requiring specific criteria to be met across multiple sessions, it helps filter out false signals and identifies high-probability reversal points where institutional investors are likely beginning to accumulate positions.
Sweep Area
The Sweep area feature enhances the traditional FTD concept by incorporating modern liquidity analysis. This overlay identifies zones where large market participants are likely to trigger stop losses before continuing the trend. These areas often represent optimal entry points for traders looking to join the new uptrend with reduced risk.
🔎 BREAKDOWN
FTD Candle
The FTD formation process occurs in two distinct phases: Setup and Completion.
Setup Phase
Strong Market Decline
The market must first experience a significant downtrend
This selling pressure helps clear out weak hands and creates oversold conditions
The decline creates the potential energy for a powerful reversal
First Recovery Session
Marks the initial sign of buying pressure emerging
Often characterized by a strong reversal candle
Represents the first indication that selling pressure may be exhausting
Recovery Confirmation
The second and third days must maintain prices above the new pivot low
This consolidation period helps confirm the validity of the initial bounce
Shows that sellers are no longer in control of price action
Completion Phase:
Supply Test Session
Low volume indicates diminishing selling pressure
Price remains above the pivot low
Creates the foundation for institutional buyers to begin accumulating
Breakout Day
Price increase exceeds average profit of bullish candles
Volume increases by at least 15% compared to previous session
Shows strong institutional commitment to the new uptrend
Timing Window
Must occur between the 4th and 8th candle after First Recovery Session
This specific timing helps confirm the sustainability of the reversal
Based on O'Neil's research of historical market bottoms
FTD Sweep
The Post-FTD Phase introduces the Sweep concept, which is crucial for understanding how large market participants operate. This feature leverages the liquidity concept because institutional traders often need to trigger stop losses to accumulate larger positions at better prices. This helps:
Create liquidity pools for large position entries
Shake out weak hands before continuing the trend
Test the strength of the new trend by absorbing selling pressure
⚙️ USAGE
Sweep + TP & SL Strategy
Example: BTCUSDT (1D) - Replay back to 9th November 2024
After an FTD candle forms, traders can adopt a systematic approach to enhance their trading strategy. First, they should determine the swing range and convert the post-FTD zone into concrete stop loss and take profit levels, which are based on the price action during the FTD formation. Next, traders should wait for a sweep formation, as this indicates that institutional players are accumulating positions. A quick price rejection from the sweep level should be observed before executing an entry.
The reasoning behind this strategy is rooted in market microstructure. By waiting for the sweep, traders position themselves alongside institutional players who need to build large positions without causing adverse price movement. The sweep creates the liquidity they need, and the subsequent move often represents the true trend continuation.
DISCLAIMER
This indicator is not financial advice, it can only help traders make better decisions. There are many factors and uncertainties that can affect the outcome of any endeavor, and no one can guarantee or predict with certainty what will occur. Therefore, one should always exercise caution and judgment when making decisions based on past performance.

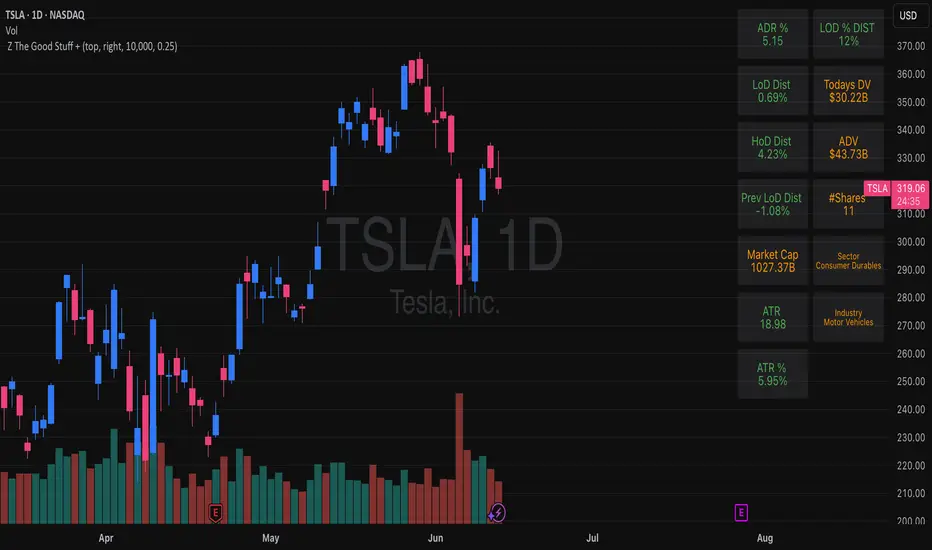
Z The Good Stuff +I created this script to have a couple datapoints that I want to look at when going through charts to find trade ideas. Qullamaggie is one of my biggest inspirations and I built in a couple of his concepts with a touch to help me with sizing properly, all explained below:
Box 1: ADR %, Average Daily Range, gives and indication of how volatile the stock is. It uses the 20 day average % move of the current stock on the chart.
Box 2: LOD Distance, low of day distance is a quality of life element I created. It calculates the low for the current candle and color codes it red or green depending on if it's higher or lower than the daily ADR. The logic is that if a stock has an average speed, buying on a setup it is preferred if the stop distance (assuming a low of day stop) should be less than the ADR to improve the odds of more upside.
Box 3: Todays DV, this shows a rough estimate of how much money was traded on the particular day.
Box 4: ADV 20 days, similar to above this shows the 20 day $ traded average. The point to look at it is to have a better idea what position size is possible to not get stuck in something too illiquid.
Box 5: Market cap, just shows the market cap of the stock to know what size the company is.
Box 6: Number of shares, this is an additional quality of life aspect. If using low of day stops, this part calculates based on the users' inputted portfolio size and portfolio risk preference and then calculates how many stocks to buy to stay within the risk parameters. It is obviously not a sole decision making parameter nor does it guarantee any execution, but if a stock is showing an entry you want to take you can use the number of shares to help you know how many to buy. The preset is a portfolio of 10000 and a risk of 0.25%. This means that the number of shares to buy will be at the current price with lod stop that would result in a 0.25% portfolio loss. OF COURSE the actual loss depends on the execution and if the user places a stop loss order.
Hope you find it useful and feel free to give feedback! Cheers!
Position Sizing Calculator (Real-Time)█ SUMMARY
The following indicator is a Position Sizing Calculator based on Average True Range (ATR), originally developed by market technician J. Welles Wilder Jr., intended for real-time trading.
This script utilizes the user's account size, acceptable risk percentage, and a stop-loss distance based on ATR to dynamically calculate the appropriate position size for each trade in real time.
█ BACKGROUND
Developed for use on the 5-minute timeframe, this script provides traders with continuously updated, dynamic position sizes. It enables traders to instantly determine the exact number of shares and dollar amount to use for entering a trade within their acceptable risk tolerance whenever a trade opportunity arises.
This real-time position sizing tool helps traders make well-informed decisions when planning trade entries and calculating maximum stop-loss levels, ultimately enhancing risk management.
█ USER INPUTS
Trading Account Size: Total dollar value of the user's trading account.
Acceptable Risk (%): Maximum percentage of the trading account that the user is willing to risk per trade.
ATR Multiplier for Stop-Loss: Multiplier used to determine the distance of the stop-loss from the current price, based on the ATR value.
ATR Length: The length of the lookback period used to calculate the ATR value.

Dynamic Trading Strategy with Key Levels, Entry/Exit ManagementThis indicator provides a complete rule-based trading system, combining key levels, entry conditions, stop loss (SL), and take profit (TP) management. It’s designed to dynamically adapt to market conditions by identifying crucial support and resistance zones, determining entry points based on price action and volume, and calculating risk-based exit targets.
Key Features
Key Level Identification:
The indicator automatically identifies support and resistance levels based on recent price highs and lows within a customizable lookback period.
It adds a dynamic buffer around these levels using the Average True Range (ATR) to account for market volatility, ensuring the zones adjust to changing conditions.
Entry Conditions:
Bullish Entry: Triggers near the support zone when there’s upward price action, confirmed by volume spikes and bullish candlestick patterns (e.g., hammers, engulfing candles).
Bearish Entry: Triggers near the resistance zone when signs of rejection appear, confirmed by volume spikes and bearish candlestick patterns (e.g., shooting stars, bearish engulfing).
Entry zones are highlighted visually on the chart using green (bullish) and red (bearish) shaded boxes.
Stop Loss (SL) and Take Profit (TP):
Stop Loss: Calculated based on ATR multipliers, allowing you to set a volatility-adjusted risk level beyond the entry range.
Take Profit: Includes two profit-taking levels (TP1 and TP2), allowing for partial position exits. TP levels are calculated based on a reward-to-risk ratio, ensuring consistent profitability targets.
SL and TP levels are clearly marked with horizontal lines and labeled as SL, TP1, and TP2, helping you manage trade exits effectively.
Market Context Adaptability:
The indicator adapts to both trending and ranging market conditions. In trending markets, it favors trades that follow the trend, while in ranging markets, it focuses on reversals within the range boundaries.
Visual Aids:
Entry zones are highlighted with shaded boxes to indicate potential buy/sell regions.
SL, TP1, and TP2 levels are clearly drawn with labels, allowing for easy identification of exit points.
How to Use
Identify Key Levels: Look for support and resistance zones highlighted by the indicator on your chart.
Wait for Entry Conditions: When the price enters the entry range (marked by green or red boxes), wait for confirmation signals—such as volume spikes and candlestick patterns.
Manage Exits: Use the SL, TP1, and TP2 levels for structured trade management. Consider scaling out partially at TP1 and exiting fully at TP2.
Ideal For:
This indicator is suitable for traders who prefer a systematic approach to trading, with clear entry and exit rules. It is particularly helpful for those looking to balance risk and reward with well-defined take profit and stop loss levels.

Trade Manager 2Hi Traders,
this manager will make it easier for you to enter lots into your trading platform. Just go to the indicator settings, set your trading account amount, RRR, % risk and then give ok. If you then know where you want to put the stop loss then reopen, enter the value and hit ok again. The chart will show you exactly the stop loss and take profit as you wanted. The stop loss will always stay where you enter it and the take profit will move with the lot size as the price goes further or closer to the stop loss.
This should help when entering the number of lots, TP, SL into the platform.

ATR+StdTR Band and Trailing StopThis Pine Script code plots the "ATR+StdTR Band and Trailing Stop," serving as a tool for volatility-based risk management and trend detection. While bands are typically set using a multiple of ATR, this script uses StdTR (the True Range standard deviation) and sets the band width based on ±(ATR + n times StdTR). StdTR is a great tool for detecting price volatility and anomalies, allowing traders to adapt to rapid changes in extreme market conditions. This helps traders proactively manage risk during sudden market fluctuations.
The following features are provided:
Table Display
A table is shown on the chart, allowing traders to visually track the current ATR value, StdTR (σ), and the long/short stop-loss levels (±ATR ± nσ). This enables real-time monitoring of risk management data.
Band Plots
The script plots bands that combine ATR with StdTR (nσ).
The upper and lower bands are calculated using the previous candle’s closing price (the source is customizable) and are plotted as ±(ATR + nσ), providing a clear visual of the price range.
ATR ± nσ Trailing Stop
The trailing stop dynamically adjusts the stop-loss levels based on price movements. In an uptrend, the stop-loss rises, while in a downtrend, it lowers, helping traders lock in profits while minimizing losses during significant reversals.
Breakout Detection
Breakouts are detected when the price exceeds the upper band or drops below the lower band. A visual marker (X) is displayed on the chart, allowing traders to quickly recognize when the price has moved beyond normal volatility ranges, making it easier to respond to trend formations or reversals.
Customization Points:
The ATR period and StdTR (n) are fully customizable.
The source for ATR band calculation can be adjusted, allowing traders to choose from close, open, high, low, etc.
The table’s display position and design (text color, size, etc.) can be customized to present the information clearly and effectively.

Options Series - P_SAR And Supertrend
The provided PineScript combines two well-known indicators—Parabolic SAR (P_SAR) and Supertrend—to create a comprehensive trading tool. Here are some powerful insights and the importance of this script:
⭐ 1. Supertrend Indicator:
What it does: The Supertrend indicator is based on the Average True Range (ATR) and is used to identify trend direction. When the price is above the Supertrend line, it suggests an uptrend, and when below, a downtrend.
Insights:
Trend Following: By adjusting the ATR length (atrPeriod) and the multiplier (factor), you can fine-tune the sensitivity of the Supertrend. A smaller ATR or factor results in more frequent trend changes, whereas larger values make the indicator more robust but slower to react.
Trend Visualization: The script highlights trends with the help of green and red lines, offering a clear visual cue for traders. The uptrend is filled with a translucent green and the downtrend with red, allowing quick identification of market momentum.
⭐ 2. Parabolic SAR (P_SAR):
What it does: The Parabolic SAR is a time/price-based indicator that helps identify potential reversals in the market. The dots (SAR) follow the price and move closer to it as the trend progresses.
Insights:
Trailing Stops: This is commonly used by traders to trail stop losses, as the SAR moves closer to price as the trend strengthens.
Combining with Supertrend: The SAR dots in this script act as an additional confirmation for trend direction. For instance, when the price is above both the SAR and Supertrend, it strongly suggests an uptrend.
⭐ 3. Bar Coloring Based on Trend Confirmation:
What it does: The script calculates conditions based on whether the price is above or below both the Supertrend and SAR values.
Insights:
Bullish/Bearish Confirmation: The combination of these two indicators provides a stronger confirmation of trend direction compared to using either one alone. For example:
Green Bars: If the price is above both the Supertrend and SAR, it signals a strong uptrend (bullish).
Red Bars: If the price is below both, it suggests a strong downtrend (bearish).
Visual Alerts: The candle colors are adjusted based on these conditions, providing a quick visual alert for traders to take action.
⭐ 4. Importance of Using Both Supertrend and P_SAR:
Multiple Confirmations: Combining the Supertrend and Parabolic SAR increases the accuracy of trend-following strategies. Each indicator has its strengths: Supertrend is good for identifying the overall trend, while the SAR excels at identifying potential reversals.
Risk Management: This script can help you not only identify trends but also manage your positions more effectively. The Parabolic SAR, for example, can serve as a dynamic stop-loss level, while the Supertrend can help you stay in trades longer by smoothing out noise in the market.
⭐ 5. Customizable Inputs:
Adaptability: The user can adjust the ATR period, factor, start, increment, and maximum values, tailoring the script to different market conditions and timeframes. This flexibility is essential, as each asset class or market may require different parameter settings.
⭐ 6. Practical Application in Trading:
Entry and Exit Signals: The script can be used to generate entry and exit signals. For instance:
Buy Signal: When the bar turns green (price is above Supertrend and SAR), it could be a signal to go long.
Sell Signal: When the bar turns red (price is below Supertrend and SAR), it could be a signal to go short or exit a long position.
Stop-Loss Placement: The Parabolic SAR dots can act as trailing stop-loss levels, helping traders lock in profits as trends progress.
Trend Continuation vs. Reversal: The Supertrend provides a broader view of the trend, while the Parabolic SAR provides pinpoint entry/exit signals for reversals.
🚀 Conclusion:
This script is a robust combination of trend-following and reversal indicators, making it a versatile tool for traders. The dual confirmation from Supertrend and Parabolic SAR reduces false signals, and the color-coded bars provide quick insights into market conditions. When used properly, this can greatly improve your ability to catch trends early, exit at the right moment, and manage risk effectively.

Easy Scalping Lot Calculator for ForexThe calculator was created to make it easier to calculate the lot size on Forex. I planned to use it for the following pairs: AUDCAD, AUDCHF, AUDJPY, AUDUSD, EURAUD, EURCAD, EURCHF, EURGBP, EURJPY, EURNZD, EURUSD, GBPCHF, GBPJPY, GBPUSD, NZDUSD, USDCAD, USDCHF, USDJPY, XAUUSD.
The indicator is a table that shows the calculation of the lot for a predetermined stop loss.
For example, you are planning a trade, have calculated a stop loss of 15 points, and by checking the table you understand approximately what lot you need to use to limit your risk.
In the settings you can change the risk and also determine the stop loss value in points.
The calculator does not take into account the spread in the calculations.
There are websites where you can accurately calculate the lot, but if you trade on small time frames this is not suitable for you.
The calculator uses the formula:
Lot size = maximum risk / stop loss (in pips) / minimum pip value x minimum trading lot.

Scalping System by Machine# Custom Trading System Indicator
This Pine Script indicator is designed to identify potential trading setups based on a specific set of rules. It's intended for use on lower timeframes (M1-M5) in the forex market, particularly during the New York-London overlap period.
## Key Features
1. **EMA Condition**: Uses a 20-period Exponential Moving Average (EMA) to determine trend direction.
2. **Candle Analysis**: Identifies strong bars and candle color changes.
3. **Volume Confirmation**: Checks for increasing volume.
4. **Volatility Filter**: Utilizes the Average True Range (ATR) to gauge market volatility.
5. **Time-based Filter**: Highlights the New York-London overlap period.
6. **Visual Aids**: Plots potential entry points, stop losses, and take profit levels.
## Trading Rules
1. **Buy Signal**:
- Price is above the 20 EMA
- Candle color changes from red to green
- Current candle is a strong bar (closing within 75% of its range)
- Volume is higher than the previous bar
- ATR(14) is above 4 pips OR it's during the NY-London overlap
2. **Sell Signal**:
- Price is below the 20 EMA
- Candle color changes from green to red
- Current candle is a strong bar (closing within 75% of its range)
- Volume is higher than the previous bar
- ATR(14) is above 4 pips OR it's during the NY-London overlap
3. **Stop Loss**: Placed near the low of the setup candle for buys, or near the high for sells.
4. **Take Profit**: Aimed at 1R (one times the range of the setup candle).
## Visual Elements
- **20 EMA**: Plotted as a blue line on the chart.
- **Buy Signals**: Green triangles below the candles.
- **Sell Signals**: Red triangles above the candles.
- **Stop Loss Levels**: Small red dots at the calculated stop loss prices.
- **Take Profit Levels**: Small green dots at the calculated take profit prices.
- **Information Table**: Displays current values for ATR, strong bar condition and volume condition.
## Usage Notes
1. This indicator is designed for manual trading, not automated execution.
2. It works best when combined with analysis of major trend lines, support, and resistance levels.
3. Exercise caution with very large setup candles.
4. Consider additional filters or money management rules for enhanced performance.
5. For higher timeframe bias validation, consider incorporating a 100-period break of structure (BOS) analysis.
## Customization
The indicator includes several input parameters that can be adjusted:
- EMA Length
- ATR Length and Threshold
- Volume Multiplier
- Strong Bar Percentage
Users can also toggle the visibility of stop loss and take profit markers.
Remember, while this indicator can identify potential setups, it should be used in conjunction with other forms of analysis and risk management strategies. Always consider the overall market context and your personal risk tolerance when making trading decisions.

ACD Indicator [TradingFinder] M Fisher Pivots Methodology Signal🔵 Introduction
The book "The Logical Trader" begins with a comprehensive review of the ACD Methodology principles, which include identifying specific price points related to the opening range.
This method allows you to set reference points for trading and use points "A" and "C" for trade entry. You will also learn about the "Pivot Range" and how to combine them with the ACD method to maximize position size and minimize risk.
In this indicator, the strategy is implemented to make it easier to use.
🔵 How to Use
The "ACD" strategy can be applied to various markets such as stocks, commodities, or forex, providing buy and sell signals that allow you to set your price targets and stop losses.
This strategy is based on the assumption that the opening range of trades is statistically significant each day, meaning the initial market fluctuations influence the market until the end of the day.
The ACD trading strategy is known as a breakout strategy and performs best in volatile or strongly trending markets, such as crude oil and stocks.
Some of the rules for using the ACD strategy include the following :
Consider points A and C as reference points and continuously pay attention to these points during trades. These points serve as entry and exit points for trades.
Examine daily and multi-day pivot ranges to analyze market trends. If the price is above the pivots, the trend is upward, and if below the pivots, the trend is downward.
Trading with the ACD strategy in forex is possible using the ACD indicator. This indicator is a technical tool used to measure the balance between supply and demand in the market. By analyzing trading volume and price, this indicator helps traders identify trend strength and suitable entry and exit points.
To use the ACD indicator, consider the following :
Identifying strong trends: The ACD indicator can help you identify strong and stable trends in the market.
Determining entry and exit points: ACD provides buy and sell signals to enter or exit trades at the best possible time.
Bullish Setup :
When the "A up" line is broken, it is advisable to wait for some time to ensure that this is not a "Fake Breakout" and that the price stabilizes above this line.
After entering the trade, the best stop loss you can choose is below the "A down" line. However, it is recommended to test this in backtests to achieve the best results. The suitable reward-to-risk ratio for this strategy is 1, which should also be backtested.
Bearish Setup :
When the "A down" line is broken, it is advisable to wait for some time to ensure that this is not a "Fake Breakout" and that the price stabilizes below this line.
After entering the trade, the best stop loss you can choose is above the "A up" line. However, it is recommended to test this in backtests to achieve the best results. The suitable reward-to-risk ratio for this strategy is 1, which should also be backtested.
🔵 Setting
NDay Pivot Range Period : Using this entry you can specify the number of days to calculate NDay Pivot Range.
Show Daily Pivot Range : Set the Daily Pivot color and displayed or not.
Show NDay Pivot Range : Set the NDay Pivot color and displayed or not.
ATR Period Levels : Determining the period of the ATR indicator, which is used to determine the A and C levels.
Show Tokyo ACD Setup : Set the Tokyo ACD Setup color and displayed or not.
Tokyo Opening Range Time : The amount of time taken to determine the opening range. You can set this number between 5 and 60 minutes.
Tokyo Session : Market start and end time.
A Level Multiplier : The coefficient that is multiplied by ATR to determine the distance of line A up and A down.
C Level Multiplier : The coefficient that is multiplied by ATR to determine the distance of line C up and C down.
The same settings exist for the London and New York sessions.

Multi Timeframe Relative Strength Index {DCAquant}Overview
The Multi Timeframe Relative Strength Index (MTF RSI) is a powerful technical analysis tool designed to provide insights into market momentum and potential trend reversals across multiple timeframes. Leveraging the Relative Strength Index (RSI) formula, this indicator offers traders a comprehensive view of market sentiment and identifies overbought and oversold conditions.
Key Features
RSI Calculation:
Utilizes the standard RSI calculation formula to measure the magnitude of recent price changes and assess the strength of market trends.
Employs a user-defined length parameter to customize the sensitivity of the RSI calculation based on trading preferences.
Multiple Timeframe Analysis:
Allows traders to analyze RSI values across up to six different timeframes, ranging from minutes to days, providing a holistic perspective on market dynamics.
Calculates RSI values independently for each selected timeframe, enabling comparison and trend identification.
Threshold Levels:
Defines overbought and oversold levels to highlight potential reversal points in market trends.
Offers flexibility in adjusting threshold levels based on individual risk tolerance and trading strategies.
Neutral Zone:
Establishes upper and lower neutral thresholds to identify periods of consolidation or sideways movement in price.
Helps traders distinguish between trending and ranging market conditions for more accurate analysis.
Moving Average Smoothing:
Provides the option to apply moving average smoothing to aggregated RSI values for enhanced clarity and reduced noise.
Enables smoother visualization of RSI trends, facilitating easier interpretation for traders.
Visual Representation:
Plots the aggregated MTF RSI values on the price chart, allowing traders to visually assess market momentum and potential reversal points.
Utilizes color-coded backgrounds to indicate Long, Short, or Neutral conditions for quick identification.
Dynamic Table Display:
Displays trading signals alongside graphical indicators (rocket for Long, snowflake for Short, and star for Neutral) in a customizable table format.
Offers flexibility in table placement and size to accommodate user preferences.
How to Use:
Parameter Configuration:
Adjust the length parameter to fine-tune the sensitivity of the RSI calculation based on the desired timeframe and trading strategy.
Define overbought and oversold levels to identify potential reversal points in market trends.
Customize upper and lower neutral thresholds to differentiate between trending and ranging market conditions.
Interpretation:
Monitor the aggregated MTF RSI values plotted on the price chart for signals of overbought or oversold conditions.
Pay attention to color-coded backgrounds and graphical indicators in the table for actionable trading insights.
Trading Strategy:
Consider entering Long positions when the aggregated MTF RSI is above the upper neutral threshold, indicating potential bullish momentum.
Evaluate Short opportunities when the aggregated MTF RSI falls below the lower neutral threshold, signaling possible bearish momentum.
Exercise caution during Neutral conditions, as there may be uncertainty in market direction.
Risk Management:
Combine MTF RSI analysis with robust risk management strategies, including stop-loss and take-profit levels, to manage trading risks effectively.
Practice prudent risk management and trade within your risk tolerance to minimize potential losses.
Disclaimer
Trading in financial markets involves risk, and past performance is not indicative of future results. The use of the MTF RSI indicator does not guarantee profits or prevent losses. Traders should conduct their own analysis, exercise caution, and seek advice from qualified financial professionals before making trading decisions.

Tetuan SniperThe TEMA and EMA Crossover Alert with SL, TP, and Order Signal strategy combines the power of Triple Exponential Moving Average (TEMA) and Exponential Moving Average (EMA) to generate high-quality trading signals. This strategy is designed to provide clear entry and exit points, manage risk through dynamic Stop Loss (SL) and Take Profit (TP) levels, and optimize trade sizes based on account balance and risk tolerance.
Key Features:
EMA and TEMA Crossover:
The strategy identifies potential buy and sell signals based on the crossover of EMA and TEMA. A buy signal is generated when TEMA crosses above EMA, and a sell signal is generated when TEMA crosses below EMA.
Dynamic Stop Loss (SL) and Take Profit (TP):
Stop Loss levels are dynamically set based on a user-defined number of pips below (for buy orders) or above (for sell orders) the lowest or highest point since the crossover.
Take Profit levels are dynamically adjusted using another TEMA, providing a flexible exit strategy that adapts to market conditions.
Lot Size Calculation:
The strategy calculates the optimal lot size based on the account balance, risk percentage per trade, and the number of maximum open orders. For JPY pairs, the lot size is adjusted by dividing by 100 to account for the different pip value.
The lot size is rounded to two decimal places for better readability and precision.
Visual Alerts and Labels:
Clear visual alerts and labels are provided for each buy and sell signal, including the recommended SL, TP, and lot size. The labels are placed in a way to avoid overlapping important chart elements.
Trend Visualization:
The area between the TEMA and EMA is colored to indicate the trend, with green for bullish trends and red for bearish trends, making it easy to visualize the market direction.
Inputs:
SL Points: Number of pips for the Stop Loss.
EMA Period: Period for the Exponential Moving Average.
TEMA Period: Period for the Triple Exponential Moving Average.
Account Balance: The total account balance for calculating the lot size.
Risk Percentage: The percentage of the account balance to risk per trade.
Take Profit TEMA Period: Period for the TEMA used to set Take Profit levels.
Lot per Pip Value: The value of 1 pip per lot.
Maximum Open Orders: The maximum number of open orders to split the balance among.
Example Usage
This strategy is suitable for traders who want to automate their trading signals and manage risk effectively. By combining TEMA and EMA crossovers with dynamic SL and TP levels and precise lot size calculation, traders can achieve a disciplined and methodical approach to trading.

Liquidity Finder🔵 Introduction
The concept of "liquidity pool" or simply "liquidity" in technical analysis price action refers to areas on the price chart where stop losses accumulate, and the market, by reaching those areas and collecting liquidity (Stop Hunt), provides the necessary energy to move the price. This concept is prominent in the "ICT" and "Smart Money" styles. Imagine, as depicted below, the price is at a support level. The general trader mentality is that there is "demand" for the asset at this price level, and this demand will outweigh "supply" as before. So, it is likely that the price will increase. As a result, they start buying and place their stop loss below the support area.
Stop Hunt areas are essentially traders' "stop loss" levels. These are the liquidity that institutional and large traders need to fill their orders. Consequently, they penetrate the price below support areas or above resistance areas to touch their stop loss and fill their orders, and then the price trend reverses.
Cash zones are generally located under "Swings Low" and above "Swings High." More specifically, they can be categorized as support levels or resistance levels, above Double Top and Triple Top patterns, below Double Bottom and Triple Bottom patterns, above Bearish Trend lines, and below Bullish Trend lines.
Double Top and Triple Top :
Double Bottom and Triple Bottom :
Bullish Trend line and Bearish Trend line :
🔵 How to Use
To optimally use this indicator, you can adjust the settings according to the symbol, time frame, and your needs. These settings include the "sensitivity" of the "liquidity finder" function and the swing periods related to static and dynamic liquidity lines.
"Statics Liquidity Line Sensitivity" is a number between 0 and 0.4. Increasing this number decreases the sensitivity of the "Statics Liquidity Line Detection" function and increases the number of lines identified. The default value is 0.3.
"Dynamics Liquidity Line Sensitivity" is a number between 0.4 and 1.95. Increasing this number increases the sensitivity of the "Dynamics Liquidity Line Detection" function and decreases the number of lines identified. The default value is 1.
"Statics Period Pivot" is set to 8 by default. By changing this number, you can specify the period for the static liquidity line pivots.
"Dynamics Period Pivot" is set to 3 by default. By changing this number, you can specify the period for the dynamic liquidity line pivots.
🔵 Settings
Access to adjust the inputs of Static Dynamic Liquidity Line Sensitivity, Dynamics Liquidity Line Sensitivity, Statics Period Pivot, and Dynamics Period Pivot is possible from this section.
Additionally, you can enable or disable liquidity lines as needed using the buttons for "Show Statics High Liquidity Line," "Show Statics Low Liquidity Line," "Show Dynamics High Liquidity Line," and "Show Dynamics Low Liquidity Line."

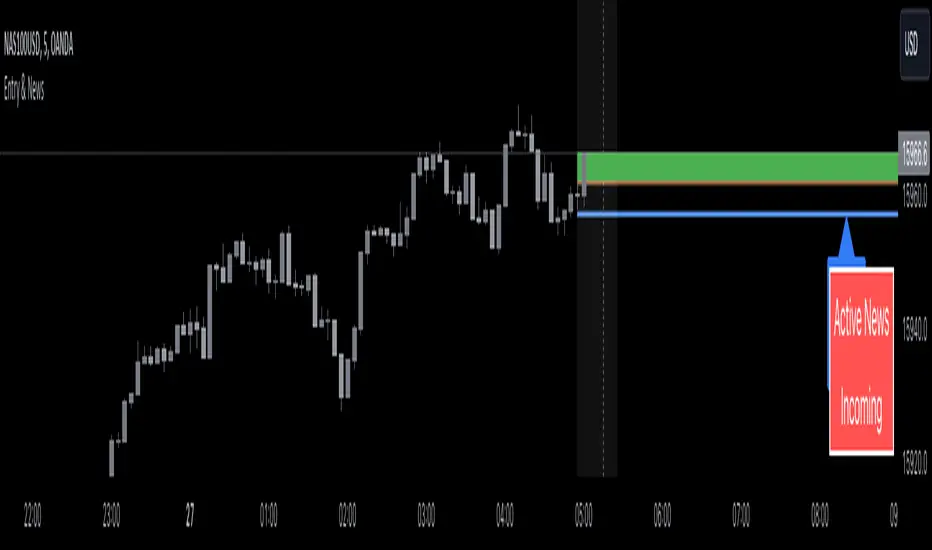
Entry Assistant & News AlertIntention Of This Indicator
This indicator is intended to be used as an assistant in combination with a technical strategy.
This indicator has several functions intended to assist you at entering positions.
This indicator is intended to be used with strategies that place Stop Losses above / below candles, and entries at the BOC ( Break Of The Previous Candle , For Longs it is when price goes above the previous candles high, For Shorts it is when price goes below the previous candles low)
This indicator allows you to enter daily news release times, and it will warn you before and after that news release time ( to help you stay out of trading news )
This indicator Draw / Displays the following
A line below ( for Longs ) / above ( for Shorts ) the current candle, with an additional pip value for extra space ( this displays where to place your Stop Loss )
A label displaying the price of the Stop Loss line, to assist in placing the Stop Loss
A line displaying where the BOC is ( based off of going Long or going Short )
A box that appears when the BOC has occurred ( entry signal )
A line displaying where the news release is going to happen ( only according to your time input settings )
A box that surrounds the news release ( only according to your time input settings )
A table in the bottom right corner that shows you when there is Active News ( only according to your time input settings )
Inputs
Inputs to change the aesthetics ( colours etc. )
Numeric inputs to modify the placement / spacing of the Stop Loss / Entry signal / News
Toggles to activate or deactivate features
Disclaimer
This indicator does not guaranteed to work for every instrument ( always test before use! )
It is not at all intended to be a signal indicator on its own, but rather only to give a signal when used with specific technical strategies that us BOC entries.
This indicator is not guaranteed to be accurate, or error free.
This indicator is not signalling winning entries or high probability entries.
You must manually enter the news time inputs, this indicator does not automatically show you when there is a news release
This is a combination indicator of my Entry Assistant and my News Alert indicator, both can be found and used separately.
Entry Assistant by IvanIntention Of This Indicator
This indicator is intended to be used as an assistant in combination with a technical strategy.
This indicator has several functions intended to assist you at entering positions.
This indicator is intended to be used with strategies that place Stop Losses above / below candles, and entries at the BOC ( Break Of The Previous Candle , For Longs it is when price goes above the previous candles high, For Shorts it is when price goes below the previous candles low)
This indicator Draw / Displays the following
A line below ( for Longs ) / above ( for Shorts ) the current candle, with an additional pip value for extra space ( this displays where to place your Stop Loss )
A label displaying the price of the Stop Loss line, to assist in placing the Stop Loss
A line displaying where the BOC is ( based off of going Long or going Short )
A box that appears when the BOC has occurred ( entry signal )
Inputs
Inputs to change the aesthetics ( colours etc. )
Numeric inputs to modify the placement / spacing of the Stop Loss / Entry signal
Toggles to activate or deactivate features
Disclaimer
This indicator does not currently work for every instrument ( it only works for most Forex pairs and some Indices )
It is not at all intended to be a signal indicator on its own, but rather only to give a signal when used with specific technical strategies that us BOC entries.
This indicator is not guaranteed to be accurate, or error free.
This indicator is not signalling winning entries or high probability entries.

Support & Resistance AI (K means/median) [ThinkLogicAI]█ OVERVIEW
K-means is a clustering algorithm commonly used in machine learning to group data points into distinct clusters based on their similarities. While K-means is not typically used directly for identifying support and resistance levels in financial markets, it can serve as a tool in a broader analysis approach.
Support and resistance levels are price levels in financial markets where the price tends to react or reverse. Support is a level where the price tends to stop falling and might start to rise, while resistance is a level where the price tends to stop rising and might start to fall. Traders and analysts often look for these levels as they can provide insights into potential price movements and trading opportunities.
█ BACKGROUND
The K-means algorithm has been around since the late 1950s, making it more than six decades old. The algorithm was introduced by Stuart Lloyd in his 1957 research paper "Least squares quantization in PCM" for telecommunications applications. However, it wasn't widely known or recognized until James MacQueen's 1967 paper "Some Methods for Classification and Analysis of Multivariate Observations," where he formalized the algorithm and referred to it as the "K-means" clustering method.
So, while K-means has been around for a considerable amount of time, it continues to be a widely used and influential algorithm in the fields of machine learning, data analysis, and pattern recognition due to its simplicity and effectiveness in clustering tasks.
█ COMPARE AND CONTRAST SUPPORT AND RESISTANCE METHODS
1) K-means Approach:
Cluster Formation: After applying the K-means algorithm to historical price change data and visualizing the resulting clusters, traders can identify distinct regions on the price chart where clusters are formed. Each cluster represents a group of similar price change patterns.
Cluster Analysis: Analyze the clusters to identify areas where clusters tend to form. These areas might correspond to regions of price behavior that repeat over time and could be indicative of support and resistance levels.
Potential Support and Resistance Levels: Based on the identified areas of cluster formation, traders can consider these regions as potential support and resistance levels. A cluster forming at a specific price level could suggest that this level has been historically significant, causing similar price behavior in the past.
Cluster Standard Deviation: In addition to looking at the means (centroids) of the clusters, traders can also calculate the standard deviation of price changes within each cluster. Standard deviation is a measure of the dispersion or volatility of data points around the mean. A higher standard deviation indicates greater price volatility within a cluster.
Low Standard Deviation: If a cluster has a low standard deviation, it suggests that prices within that cluster are relatively stable and less likely to exhibit sudden and large price movements. Traders might consider placing tighter stop-loss orders for trades within these clusters.
High Standard Deviation: Conversely, if a cluster has a high standard deviation, it indicates greater price volatility within that cluster. Traders might opt for wider stop-loss orders to allow for potential price fluctuations without getting stopped out prematurely.
Cluster Density: Each data point is assigned to a cluster so a cluster that is more dense will act more like gravity and
2) Traditional Approach:
Trendlines: Draw trendlines connecting significant highs or lows on a price chart to identify potential support and resistance levels.
Chart Patterns: Identify chart patterns like double tops, double bottoms, head and shoulders, and triangles that often indicate potential reversal points.
Moving Averages: Use moving averages to identify levels where the price might find support or resistance based on the average price over a specific period.
Psychological Levels: Identify round numbers or levels that traders often pay attention to, which can act as support and resistance.
Previous Highs and Lows: Identify significant previous price highs and lows that might act as support or resistance.
The key difference lies in the approach and the foundation of these methods. Traditional methods are based on well-established principles of technical analysis and market psychology, while the K-means approach involves clustering price behavior without necessarily incorporating market sentiment or specific price patterns.
It's important to note that while the K-means approach might provide an interesting way to analyze price data, it should be used cautiously and in conjunction with other traditional methods. Financial markets are influenced by a wide range of factors beyond just price behavior, and the effectiveness of any method for identifying support and resistance levels should be thoroughly tested and validated. Additionally, developments in trading strategies and analysis techniques could have occurred since my last update.
█ K MEANS ALGORITHM
The algorithm for K means is as follows:
Initialize cluster centers
assign data to clusters based on minimum distance
calculate cluster center by taking the average or median of the clusters
repeat steps 1-3 until cluster centers stop moving
█ LIMITATIONS OF K MEANS
There are 3 main limitations of this algorithm:
Sensitive to Initializations: K-means is sensitive to the initial placement of centroids. Different initializations can lead to different cluster assignments and final results.
Assumption of Equal Sizes and Variances: K-means assumes that clusters have roughly equal sizes and spherical shapes. This may not hold true for all types of data. It can struggle with identifying clusters with uneven densities, sizes, or shapes.
Impact of Outliers: K-means is sensitive to outliers, as a single outlier can significantly affect the position of cluster centroids. Outliers can lead to the creation of spurious clusters or distortion of the true cluster structure.
█ LIMITATIONS IN APPLICATION OF K MEANS IN TRADING
Trading data often exhibits characteristics that can pose challenges when applying indicators and analysis techniques. Here's how the limitations of outliers, varying scales, and unequal variance can impact the use of indicators in trading:
Outliers are data points that significantly deviate from the rest of the dataset. In trading, outliers can represent extreme price movements caused by rare events, news, or market anomalies. Outliers can have a significant impact on trading indicators and analyses:
Indicator Distortion: Outliers can skew the calculations of indicators, leading to misleading signals. For instance, a single extreme price spike could cause indicators like moving averages or RSI (Relative Strength Index) to give false signals.
Risk Management: Outliers can lead to overly aggressive trading decisions if not properly accounted for. Ignoring outliers might result in unexpected losses or missed opportunities to adjust trading strategies.
Different Scales: Trading data often includes multiple indicators with varying units and scales. For example, prices are typically in dollars, volume in units traded, and oscillators have their own scale. Mixing indicators with different scales can complicate analysis:
Normalization: Indicators on different scales need to be normalized or standardized to ensure they contribute equally to the analysis. Failure to do so can lead to one indicator dominating the analysis due to its larger magnitude.
Comparability: Without normalization, it's challenging to directly compare the significance of indicators. Some indicators might have a larger numerical range and could overshadow others.
Unequal Variance: Unequal variance in trading data refers to the fact that some indicators might exhibit higher volatility than others. This can impact the interpretation of signals and the performance of trading strategies:
Volatility Adjustment: When combining indicators with varying volatility, it's essential to adjust for their relative volatilities. Failure to do so might lead to overemphasizing or underestimating the importance of certain indicators in the trading strategy.
Risk Assessment: Unequal variance can impact risk assessment. Indicators with higher volatility might lead to riskier trading decisions if not properly taken into account.
█ APPLICATION OF THIS INDICATOR
This indicator can be used in 2 ways:
1) Make a directional trade:
If a trader thinks price will go higher or lower and price is within a cluster zone, The trader can take a position and place a stop on the 1 sd band around the cluster. As one can see below, the trader can go long the green arrow and place a stop on the one standard deviation mark for that cluster below it at the red arrow. using this we can calculate a risk to reward ratio.
Calculating risk to reward: targeting a risk reward ratio of 2:1, the trader could clearly make that given that the next resistance area above that in the orange cluster exceeds this risk reward ratio.
2) Take a reversal Trade:
We can use cluster centers (support and resistance levels) to go in the opposite direction that price is currently moving in hopes of price forming a pivot and reversing off this level.
Similar to the directional trade, we can use the standard deviation of the cluster to place a stop just in case we are wrong.
In this example below we can see that shorting on the red arrow and placing a stop at the one standard deviation above this cluster would give us a profitable trade with minimal risk.
Using the cluster density table in the upper right informs the trader just how dense the cluster is. Higher density clusters will give a higher likelihood of a pivot forming at these levels and price being rejected and switching direction with a larger move.
█ FEATURES & SETTINGS
General Settings:
Number of clusters: The user can select from 3 to five clusters. A good rule of thumb is that if you are trading intraday, less is more (Think 3 rather than 5). For daily 4 to 5 clusters is good.
Cluster Method: To get around the outlier limitation of k means clustering, The median was added. This gives the user the ability to choose either k means or k median clustering. K means is the preferred method if the user things there are no large outliers, and if there appears to be large outliers or it is assumed there are then K medians is preferred.
Bars back To train on: This will be the amount of bars to include in the clustering. This number is important so that the user includes bars that are recent but not so far back that they are out of the scope of where price can be. For example the last 2 years we have been in a range on the sp500 so 505 days in this setting would be more relevant than say looking back 5 years ago because price would have to move far to get there.
Show SD Bands: Select this to show the 1 standard deviation bands around the support and resistance level or unselect this to just show the support and resistance level by itself.
Features:
Besides the support and resistance levels and standard deviation bands, this indicator gives a table in the upper right hand corner to show the density of each cluster (support and resistance level) and is color coded to the cluster line on the chart. Higher density clusters mean price has been there previously more than lower density clusters and could mean a higher likelihood of a reversal when price reaches these areas.
█ WORKS CITED
Victor Sim, "Using K-means Clustering to Create Support and Resistance", 2020, towardsdatascience.com
Chris Piech, "K means", stanford.edu
█ ACKNOLWEDGMENTS
@jdehorty- Thanks for the publish template. It made organizing my thoughts and work alot easier.

[OKX Signal Bot] Indicator Script Set Up TemplateDiscover the power of the Turtle Trade Channels Indicator (TUTCI), an innovative tool that integrates the time-tested principles of the legendary Turtle Trade system. This groundbreaking system shattered the belief that successful traders are born, not made, by transforming ordinary individuals into profitable traders.
The Turtle Trade Experiment, which achieved a remarkable 80% annual return over four years and amassed a staggering $150 million, showcased the immense potential of this trend-following strategy. Unlike the conventional "buy low and sell high" approach, the Turtle Trade system embraces a different philosophy—one of capturing substantial profits by following prevailing trends.
At the heart of the Turtle Trade Channels Indicator lies the concept of Donchian Channels, a powerful technical indicator developed by Richard Donchian. Building upon this foundation, the main rule of TUTCI is to identify 20-day breakouts and capitalize on them, while simultaneously utilizing a profit-taking strategy based on breaching 10-day highs or lows.
For long trades, the indicator signals a buying opportunity when the price breaks above the 20-day high. Conversely, for short trades, a selling opportunity arises when the price falls below the 20-day low. This systematic approach allows traders to align themselves with the prevailing momentum, capturing significant price movements.
To further enhance trading precision, TUTCI incorporates two key lines. The red line represents the trading line, indicating the direction of the trend. Price bars above the trend line suggest an uptrend, while those below indicate a downtrend. The dotted blue line serves as the exit line, guiding traders to close their positions when price action breaches the 10-day high or low. This rule safeguards profits and helps traders avoid potential trend reversals.
The Turtle Trade Channels Indicator (TUTCI) is a versatile tool applicable to various financial markets, including stocks, commodities, and forex. By harnessing the power of breakouts and integrating profit-taking rules, this indicator empowers traders to capitalize on favorable trading opportunities while managing risk effectively.
As with any trading strategy, it is crucial to conduct thorough backtesting and evaluation of the TUTCI system before implementing it in live trading. Traders can customize the indicator's parameters to align with their trading preferences and adapt to changing market conditions. Employing sound risk management techniques, such as position sizing and stop-loss orders, is paramount to protect capital and minimize potential losses.
Experience the transformational potential of the Turtle Trade Channels Indicator (TUTCI) and embark on a journey of trend following, capturing significant profits, and achieving trading success.
These scripts are only functioning as sample script templates to support okx alert standards. It is not intended to provide any investment, tax, or legal advice, nor should it be considered an offer to purchase, sell, hold or offer any services relating to digital assets. Digital assets, including stablecoins, involve a high degree of risk, can fluctuate greatly, and can even become worthless. You should carefully consider whether trading or holding digital assets is suitable for you in light of your financial condition and risk tolerance. OKX does not provide investment or asset recommendations. You are solely responsible for your investment decisions, and OKX is not responsible for any potential losses. Past performance is not indicative of future results. Please consult your legal/tax/investment professional for questions about your specific circumstances.

A.I Fibonacci [Paradox]Description:
The A.I fibonacci is a tool designed to assist traders in identifying potential price levels following a retracement. Unlike many other Fibonacci indicators available, this script is tailored to highlight the most crucial levels for entries, take profits, and stop losses.
Key Features:
Automatic Calculation: The script automatically calculates and plots Fibonacci extension levels based on the price movement and the highs and the lows on the chart.
Optimal Levels: It emphasizes the most relevant levels for making informed trading decisions, ensuring traders focus on what specific levels.
Versatility: Suitable for all markets, making it a versatile tool for traders across different asset classes.
User-Friendly: Designed with both novice and experienced traders in mind, the script is easy to use and interpret.
How It Stands Out:
While there are numerous Fibonacci tools available, the A.I Fibonacci is distinct in its approach. It not only calculates potential price reversal areas but also pinpoints possible price levels after a retracement is completed. This dual functionality ensures traders have a comprehensive view of the market.
How to Use:
Apply the script to your desired chart.
Observe the plotted Fibonacci levels.
Use these levels to determine potential entry, exit, and stop-loss points.
Green - Entry levels
Red - Stop Loss Levels
Yellow - Take Profit Levels
Applicability:
A.I Fibonacci is designed for all markets, making it a versatile tool for forex, stocks, commodities, and more.
Conditions for Use:
The script performs optimally under various market conditions. However, as with all technical tools, it's recommended to use it in conjunction with other indicators and analysis methods for best results.

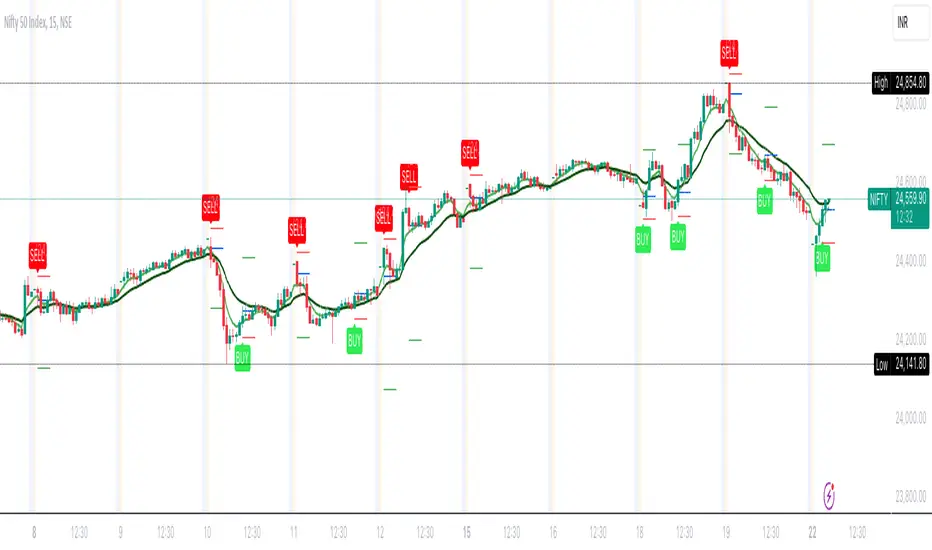
FalconRed 5 EMA Indicator (Powerofstocks)Improved version:
This indicator is based on Subhashish Pani's "Power of Stocks" 5 EMA Strategy, which aims to identify potential buying and selling opportunities in the market. The indicator plots the 5 EMA (Exponential Moving Average) and generates Buy/Sell signals with corresponding Target and Stoploss levels.
Subhashish Pani's 5 EMA Strategy is a straightforward approach. For intraday trading, a 5-minute timeframe is recommended for selling. In this strategy, you can choose to sell futures, sell calls, or buy puts as part of your selling strategy. The goal is to capture market tops by selling at the peak, anticipating a reversal for profitable trades. Although this strategy may result in frequent stop losses, they are typically small, while the minimum target should be at least three times the risk taken. By staying aligned with the trend, significant profits can be achieved. Subhashish Pani claims that this strategy has a 60% success rate.
Strategy for Selling (Short Future/Call/Stock or Buy Put):
1. When a candle completely closes above the 5 EMA (with no part of the candle touching the 5 EMA), it is considered an Alert Candle.
2. If the next candle is also entirely above the 5 EMA and does not break the low of the previous Alert Candle, ignore the previous Alert Candle and consider the new candle as the new Alert Candle.
3. Continue shifting the Alert Candle in this manner. However, when the next candle breaks the low of the Alert Candle, take a short trade (e.g., short futures, calls, stocks, or buy puts).
4. Set the stop loss above the high of the Alert Candle, and the minimum target should be 1:3 (at least three times the stop loss).
Strategy for Buying (Buy Future/Call/Stock or Sell Put):
1. When a candle completely closes below the 5 EMA (with no part of the candle touching the 5 EMA), it is considered an Alert Candle.
2. If the next candle is also entirely below the 5 EMA and does not break the high of the previous Alert Candle, ignore the previous Alert Candle and consider the new candle as the new Alert Candle.
3. Continue shifting the Alert Candle in this manner. However, when the next candle breaks the high of the Alert Candle, take a long trade (e.g., buy futures, calls, stocks, or sell puts).
4. Set the stop loss below the low of the Alert Candle, and the minimum target should be 1:3 (at least three times the stop loss).
Buy/Sell with Additional Conditions:
An additional condition is added to the buying/selling strategy:
1. Check if the closing price of the current candle is lower than the closing price of the Alert Candle for selling, or higher than the closing price of the Alert Candle for buying.
- This condition aims to filter out false moves, potentially preventing entering trades based on temporary fluctuations. However, it may cause you to miss out on significant moves, as you will enter trades after the candle closes, rather than at the breakout point.
Note: According to Subhashish Pani, the recommended timeframe for intraday buying is 15 minutes. However, this strategy can also be applied to positional/swing trading. If used on a monthly timeframe, it can be beneficial for long-term investing as well. The rules remain the same for all types of trades and timeframes.
If you need a deeper understanding of this strategy, you can search for "Subhashish Pani's (Power of Stocks) 5 EMA Strategy" on YouTube for further explanations.
Note: This strategy is not limited to intraday trading and can be applied to positional/swing
Alpha Fractal BandsWilliams fractals are remarkable support and resistance levels used by many traders. However, it can sometimes be challenging to use them frequently and get confirmation from other oscillators and indicators. With the new "Alpha Fractal Bands", a unique blend of Williams Fractals and Bollinger Bands emerges, offering a fresh perspective. Extremes can be utilized as price reversals or for taking profits. I look forward to hearing your thoughts. Best regards... Happy trading!
An easy solution for long positions is to:
Identify a bullish trend or a potential entry point for a long position.
Set a stop-loss order to limit potential losses if the trade goes against you.
Determine a target price or take-profit level to lock in profits.
Consider using technical indicators or analysis tools to confirm the strength of the bullish trend.
Regularly monitor the trade and make necessary adjustments based on market conditions.
An easy solution for short positions could be to follow these steps:
Identify a bearish trend or a potential entry point for a short position.
Set a stop-loss order to limit potential losses if the trade goes against you.
Determine a target price or take-profit level to lock in profits.
Consider using technical indicators or analysis tools to confirm the strength of the bearish trend.
Regularly monitor the trade and make necessary adjustments based on market conditions.
Remember, it's important to conduct thorough research and analysis before entering any trade and to manage your risk effectively.
To stay updated with the content, don't forget to follow and engage with it on TV, my friends. Remember to leave comments as well :)
